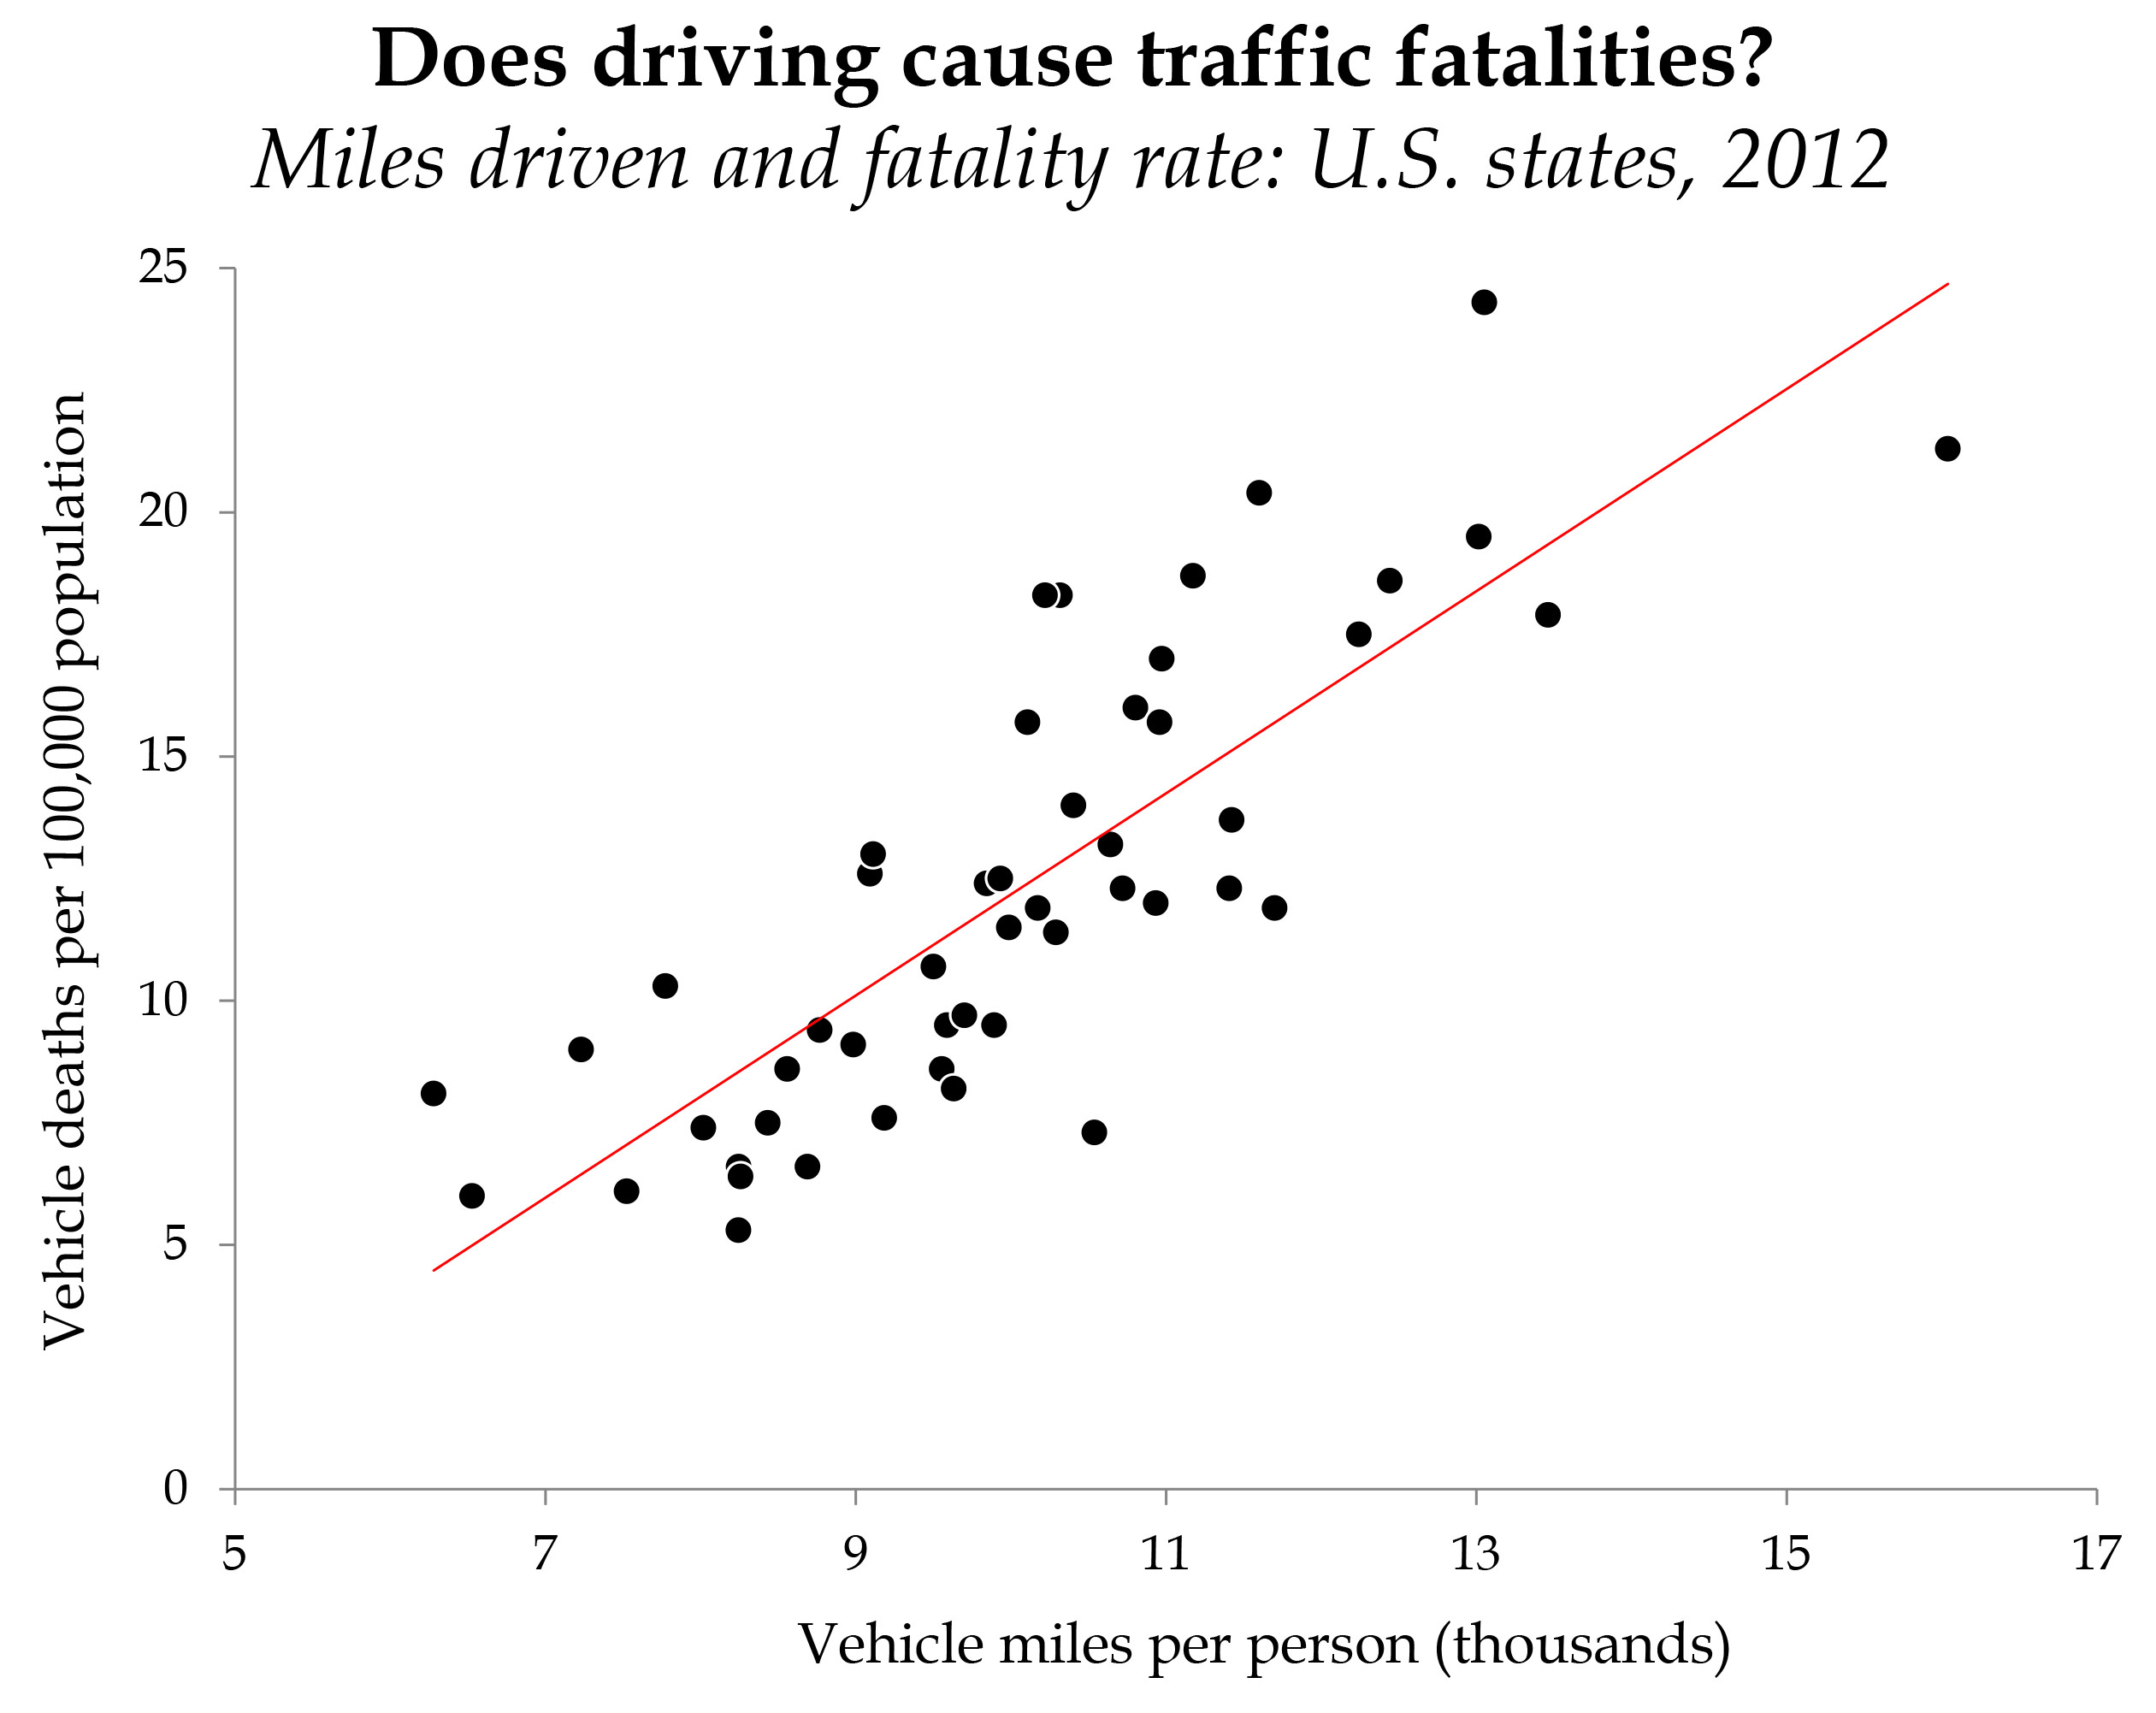
Chart of the Day: Miles Driven vs. Fatality Rates – Does driving cause traffic fatalities?

December 26, 2014 at 11:09 am

via @UrbanData on Twitter

The following tweet will take you to the source article.

Image via: familyineqaulity.wordpress.com


BuzzFeed Video: If Driving Was Taught Like Sex Ed…

October 27, 2014 at 10:00 am

via BuzzFeedVideo

Given the high number of road deaths around the world (~1.2million fatalities/year globally and ~34K in the US alone), we can definitely use something like this to get the kids ready for the road ..  It is quite funny with all the innuendos and not-so-subtle references to sex-ed. (BTW, looking at the number of hits the video has garnered on YouTube, I couldn’t  help but wish the safety videos from Govt and other non.profit organizations enjoy this level of attention).

“Roads Kill” – Washington Post Infograph shows the public health crisis on roads across the globe

February 1, 2014 at 7:43 pm

How bad is the road safety problem across the planet? Pretty bad.  The global road death toll has already reached 1.24 million per year and is on course to triple to 3.6 million per year by 2030. In “Roads Kill,” The Washington Post joins with the Pulitzer Center on Crisis Reporting to bring stories from around the world about this neglected but easily curable public health crisis.

[pageview url="http://roadskillmap.com/#58.53959476664049,89.296875,2" height="500px" border="yes"]

PSA: Don’t be one of them! Plan ahead this holiday season – Buzzed Driving is Drunk Driving!

December 18, 2013 at 5:07 pm

Dear Readers and Subscribers,

I’d like to take a leaf from the AdCouncil’s buzzed driving campaign and reiterate a key safety message, just in time as the holiday season is kicking up into a higher notch. The holidays are a time to celebrate with friends and family. But it’s also a time to make sure you are keeping safe the ones you love. Whether you’re at a family holiday gathering, a New Year’s Eve bash, or driving around with your little ones, many of our social plans will involve driving.

According to the National Highway Traffic Safety Administration (NHTSA), the winter holiday season (December 26th to New Year’s Eve) has one of the highest incidences of drunk driving fatalities.

A few alarming stats:

  • During last year’s holiday season alone, 830 lives were lost in drunk driving crashes.
  • Last year, deaths in crashes involving drunk drivers increased 4.6 percent, taking 10,322 lives compared to 9,865 in 2011.
  • Buzzed driving can cost around $10,000 in fines, legal fees and increased insurance rates.

Ring in the New Year safely and plan ahead and designating a sober driver before they go out this year.

Be safe out on the roads.  Encourage your friends and family to avoid driving buzzed.

ADC_GEN_O12541

Infograph: Driverless Cars and Eliminating Human Error

February 21, 2013 at 4:10 pm

via InsuranceQuotes.org

Here is a neat infographic that shows the benefits of moving towards autonomous vehicles.. Though some of the statistics seen in the graphic are old and needs revision (esp. fatality numbers, which continues to see a steady decline every year), it still reminds you of the sheer size and scope of the problems we encounter in the current scenario of human-piloted vehicles.  Oh, Google Cars is not the only game in town when it comes to autonomous vehicles.  Not anymore.  Most auto OEMs are ramping up their research to make sure they remain relevant when Google’s project materializes. That said, the transportation systems that are currently developed for the coming decade looks quite promising!

Driverless Cars and Eliminating Human Error

Trick or Treat! Don’t Get Hit – Study Shows Halloween Most Dangerous Day Of the Year for Children

October 31, 2012 at 4:26 pm
Halloween '07

Halloween ’07 (Photo credit: Clover_1)

Happy Halloween!

As you (or the kids in your household) venture out trick or treating tonight, I want to remind you of a few things regarding safety. Today’s press release from insurance giant StateFarmshowed how dangerous

trick or treating can be for younger children.  StateFarm says that its research with Bert Sperling’s BestPlaces,  analyzed four million records in the U.S. Department of Transportation’s Fatality Analysis Reporting System (FARS) Database revealed the following

  • Halloween Was Deadliest Day of the Year for Child Pedestrian Accidents
    One hundred and fifteen child pedestrian fatalities occurred on Halloween over the 21 years of our analysis. That is an average of 5.5 fatalities each year on October 31, which is more than double the average number of 2.6 fatalities for other days.
  • The “Deadliest Hour”
    Nearly one-fourth (26 out of 115) of accidents occurred from 6:00 – 7:00 p.m. Over 60% of the accidents occurred in the 4-hour period from 5:00 to 9:00 p.m.
  • Middle of the Block Most Hazardous
    Over 70% of the accidents occurred away from an intersection or crosswalk.
  • Ages Most at Risk on Halloween
    Most of the fatalities occurred with children ages 12-15 (32% of all child fatalities), followed by children ages 5-8 (23%).
  • Drivers Who Posed the Greatest Risk
    Young drivers ages 15-25 accounted for nearly one-third of all fatal accidents involving child pedestrians on Halloween.
  • Drivers Who Posed the Lowest Risk
    Drivers ages 36-40 and 61-65 were involved in the fewest child pedestrian fatalities on Halloween. Together, these age groups accounted for nine child pedestrian fatalities (8%) in the 21 years of the study.
  • Fatalities Declining
    Each of the last six years of the study (2005 – 2010) has seen Halloween child fatalities below the 21 year average of 5.5.

One more thing you may want to know is this: Last Halloween, more than 24,700 drivers received a red light violation, according to the Safer Roads Report 2012: Trends in Red-Light Running. So, tonight when you venture out with (or without) your kids, be careful.  Dress to be SEEN and do not become a statistic!

Related articles

Enhanced by Zemanta

Global Status Report on Road Safety – World Health Organization’s Report Explores Status of Road Safety in 178 Countries

June 23, 2009 at 12:52 pm

Do you know that over 90% of the world’s fatalities on the roads occur in low-income and middle-income countries, which have only 48% of the world’s registered vehicles?

  • 1.2 million people will die this year as a result of road crashes – more than 3200 deaths each day.
  • About 50 million people will be injured in road crashes this year, millions of whom will be disabled for life.
  • 90% of deaths due to road crashes occur in developing countries, mostly among pedestrians, bicyclists and motorcyclists – those less likely to own a car.
  • Road crashes cost low- and middle-income countries an estimated US $ 65 Billion each year – more than they receive in development aid.
  • Image Courtesy: World Health Organization

    Approximately 1.3 million people die each year on the world’s roads, and between 20 and 50 million sustain non-fatal injuries. In most regions of the world this epidemic of road traffic injuries is still increasing. In the past five years most countries have endorsed the recommendations of the World report on road traffic injury prevention which give guidance on how countries can implement a comprehensive approach to improving road safety and reducing the death toll on their roads.

    To date, however, there has been no global assessment of road safety that indicates the extent to which this approach is being implemented. This Global status report on road safety is  the first broad assessment of the status of road safety in 178 countries, using data drawn from a standardized survey conducted in 2008.

    The results show that road traffic injuries remain an important public health problem, particularly for low-income and middle-income countries. Pedestrians, cyclists and motorcyclists make up almost half of those killed on the roads, highlighting the need for these road users to be given more attention in road safety programmes.

    Image Courtesy: Apture

    The results also suggest that in many countries road safety laws need to be made more comprehensive while enforcement should be strengthened. TheGlobal status report on road safety results clearly show that significantly more action is needed to make the world’s roads safer.

    The results provide a benchmark that countries can use to assess their road safety position relative to other countries, while internationally the data presented can collectively be considered as a global “baseline” against which progress over time can be measured.  Here is a quick summary of key findings from WHO’s Director-General, Dr. Margaret Chan’s  statement during the June 15, 2009 release of the report in New York City:

    • Over 90% of these deaths occur in low-income and middle-income countries, which have less than half of the world’s registered vehicles.
    • Second, the report highlights that nearly half of those dying on the world’s roads are pedestrians, cyclists or motorcyclists. These people, who lack the protective shell of a car, are particularly vulnerable to severe and fatal injuries following a crash.  In some low-income and middle-income countries, this proportion is even higher, with up to 80% of road traffic deaths among these vulnerable groups. Clearly we are not giving enough attention to the needs of pedestrians, cyclists and motorcyclists, many of whom end up in clinics and emergency rooms, overloading already stretched health-care systems.
    • Third, the report shows that, in many countries, the laws needed to protect people are either not in place or too limited in their scope. Indeed, only 15% of countries have comprehensive laws on all the risk factors we measured. And even when legislation is adequate, most countries report that enforcement is low.  The development and effective enforcement of legislation are key ways to reduce drink-driving and excessive speed, and to increase the use of helmets, seat-belts and child restraints.
    • Finally, the report demonstrates that in many countries information about road traffic injuries is scarce. To set priorities and target and evaluate their actions, countries need to know the size of the problem, and additional information such as which groups are most affected.

    Click here to access the PDF report.

    Transport for London moves ahead with testing of Intelligent Speed Adaptation Technology

    May 12, 2009 at 6:39 pm

    (Source: Green Car Congress)

    Transport for London (TfL) will begin a six-month trial ofIntelligent Speed Adaptation (ISA) technology which aims to reduce road casualties and help drivers avoid speeding penalties.  As part of the trial, which will start this summer, a London bus will be fitted with ISA.   The trial will monitor driver behavior, journey times and the effect that driving within the speed limit has on vehicle emissions. ISA uses the digital speed limit map of London which TfL launched on 29 January 2009. This is the first time all of London’s speed limits have been mapped accurately with regular updates.

    It is estimated that if two thirds of London drivers use the ISA system, the number of road casualties in the Capital could be reduced by 10%

    This innovative technology could help any driver in London avoid the unnecessary penalties of creeping over the speed limit, and at the same time will save lives. We know the technology works, and now we want to know how drivers in all types of vehicles respond to it. ISA is intended as a road safety device, but if Londoners embrace this technology we may well see additional benefits including reduced congestion as a result of collisions and reduced vehicle emissions as drivers adopt a smoother driving style.

    —Chris Lines, Head of TfL’s London Road Safety Unit

    Isamap

    The UK government’s Commission for Integrated Transport (CfIT) and the Motorists’ Forum (MF) recently issued a joint report evaluating the impact of implementing an Intelligent Speed Adaptation (ISA) system across the entire road network on reducing deaths and injuries on the UK roads and on reducing fuel consumption and emissions of CO2 and criteria pollutants.  Of the two proposed benefits of ISA—GHG emissions reduction and increased road safety—the report concluded that the calculated social benefits of the accident savings far outweigh the values of fuel or CO2 saved.

    The intelligent technology, which works in conjunction with a GPS, enables drivers to select an option where acceleration is stopped automatically at the speed limit specific to any road in London within the M25 area. The unit can be disabled at the touch of a button, at which point it reverts to an advisory status where the current, legal speed limit is simply displayed as a driver aid. There is also a complete over-ride switch with disables the system entirely.

    The practical uses of the technology will be tested in the six month trial after which a report will be submitted to the Mayor of London, and the technology will be made available to external organizations.

    National Transportation Safety Board: Fatalities rose in 2008 for air taxi, tour flights

    April 2, 2009 at 4:57 pm

    (Source: Associated Press via Yahoo! Finance)


    Safety board says fatal accidents were up sharply in 2008 for air taxi, medical, tour flights

    WASHINGTON (AP) — There was a spike last year in deaths from crashes of air medical, air taxi and tour flights, federal safety officials said Thursday.

    The National Transportation Safety Board said there were 56 so-called on-demand flight accidents in which 66 people were killed in 2008. That’s the highest number of fatalities for such flights in eight years and an increase of 13 deaths over 2007. The on-demand accident rate was 1.52 accidents per 100,000 flight hours, virtually unchanged from the previous year.

    The board held a public hearing earlier this year examining the safety practices of the air medical helicopter industry. Fifteen people were killed in four medical helicopter crashes in 2008.

    Major U.S. airlines, however, suffered no accident fatalities in 2008 for the second consecutive year despite carrying 753 million passengers on more than 10.8 million flights, the NTSB said. Major airlines experienced 28 accidents last year, the same as 2007.

     Commuter airlines, which typically fly smaller turboprop planes, also didn’t have any accident fatalities despite making 581,000 flights last year, the board said. However, there were seven commuter airline accidents in 2008, up three from the previous year.

    There were 495 people killed — one fewer than the previous year — in general aviation accidents in 2008, the board said. General aviation includes private and corporate planes.

    Acting NTSB Chairman Mark Rosenker said the aviation safety record for 2008 was mixed.  Click here to access today’s press release and interesting statistical tables.

    Table 1. Accidents, Fatalities, and Rates, 2008 Preliminary Statistics
    U.S. Aviation
      Accidents Fatalities Flight Hours Departures Accidents per 100,000 Flight Hours Accidentsper 100,000 Departures
    All Fatal Total Aboard All Fatal All Fatal
    U.S. air carriers operating under 14 CFR 121
    – Scheduled 20 0 0 0 18,730,000 10,597,000 0.107 0.189
    – Nonscheduled 8 2 3 1 621,000 190,000 1.288 0.322 4.211 1.053
    U.S. air carriers operating under 14 CFR 135
    – Commuter 7 0 0 0 290,400 581,000 2.410 1.205
    – On-Demand 56 19 66 66 3,673,000 1.52 0.52
    U.S. general aviation 1,559 275 495 486 21,931,000 7.11 1.25
    U.S. civil aviation 1,649 296 564 553
    Other accidents in the U.S.
    – Foreign registered aircraft 6 4 7 7
    – Unregistered aircraft 7 1 1 1