Chart(s) of the day: These two charts are enough to paint the appalling state of air pollution in India

March 2, 2015 at 9:18 pm

These graphs below via Qz.com paint a compelling picture of air quality in India. In most western media discussions/stories about environmental pollution is often China-centric. One would expect China to be topping the charts when it comes to pollution, given the country’s ginormous population, its economic clout and the manufacturing prowess which earned it the “factory of the world” label, . But in reality, ‪#‎India‬ is the worst offender and it deserves far more scrutiny than China. 14 of the top 20 most polluted cities are in India and a not a single Chinese city made it to this list. Govt. of India should take urgent steps to combat this issue because of the risks it pose to public health. 

Image Courtesy: Quartz I Qz.com

Image Courtesy: Quartz I Qz.com

For what it is worth, the transportation sector is one of the major culprits, accounting for a significant portion of the overall emissions. While congestion in major cities continues to grow worse, the vehicle sales continues at a torrid pace and doesn’t show any signs of a slow down. To put this in perspective, I am borrowing the following points from the ICCT fact sheet:

  • India’s vehicle population has grown from 50 million in 2003 to 130 million in 2013.
  • Vehicle PM10 emissions have fallen 14% since 2003, but emissions will return to 2003 levels by 2017 due to vehicle population growth if new controls are not mandated

Another major source of pollution in India related to the transportation sector is the noise pollution, which requires a dedicated blog post by itself. So, one of these days I’ll get around to doing some research on that topic and write it up.

Infograph: How can you bring Vision Zero to life?

August 20, 2014 at 5:01 pm

via PTV

Did you know that for every 1km/h reduction in average speed, there is a 2% reduction in the number of crashes? With the growing population of humans and vehicles globally, the safety of road users is becoming more and more important.  The 2013 World Health Organization (WHO) report indicates that worldwide the total number of road traffic deaths is ~1.24 million per year. Only 28 countries, covering 7% of the world’s population, have comprehensive road safety laws on five key risk factors: drinking and driving, speeding, and failing to use motorcycle helmets, seat-belts, and child restraints.  What’s more scary is the fact that this number is going to rise sharply – 1.9 million fatalities /year by 2020 if we don’t take any action.

So,  how do we achieve a better safety record for the rest of the 93% global population?  How do we build communities where every one can access the transportation infrastructure safely? One of the easiest ways to reduce the number of crashes is by reducing the speed of vehicles, which can have immediate and direct impact on the number of crashes according to this infograph from PTV.  If you want to learn more about road safety, download PTV’s free white paper and register to participate in webinars on this topic in early September. 

Image Courtesy: PTV Group Traffic Inside


Beautiful Chaos – Time lapse video captures the chaotic traffic in Ho Chi Minh City

December 5, 2011 at 7:38 pm

(Source: Reddit)

Here is a really beautiful time-lapse video capture of the crazy traffic in  Ho Chi Minh City (Saigon).  The creator, Rob Whitworth,  this video says  is a culmination of 10,000 RAW images and multiple shoots capturing some of the cities relentless energy and pace of change.  check it out. Like in many Asian cities, the chaos of traffic continues to move without much disruption despite the lack of the usual traffic management infrastructure (i.e., traffic lights at intersections).  Of course, it goes without saying – traffic accidents are a leading cause of death and injuries in Country.   According to the World Health Organization,  Vietnam’s National Traffic Safety Committee (NTSC) reported more than 12,800 deaths and a further 10,546 injuries from road traffic crashes in 2007 which represents more than 35 deaths per day and a mortality rate of more than 15 per 100,000 population.

Global Status Report on Road Safety – World Health Organization’s Report Explores Status of Road Safety in 178 Countries

June 23, 2009 at 12:52 pm

Do you know that over 90% of the world’s fatalities on the roads occur in low-income and middle-income countries, which have only 48% of the world’s registered vehicles?

  • 1.2 million people will die this year as a result of road crashes – more than 3200 deaths each day.
  • About 50 million people will be injured in road crashes this year, millions of whom will be disabled for life.
  • 90% of deaths due to road crashes occur in developing countries, mostly among pedestrians, bicyclists and motorcyclists – those less likely to own a car.
  • Road crashes cost low- and middle-income countries an estimated US $ 65 Billion each year – more than they receive in development aid.
  • Image Courtesy: World Health Organization

    Approximately 1.3 million people die each year on the world’s roads, and between 20 and 50 million sustain non-fatal injuries. In most regions of the world this epidemic of road traffic injuries is still increasing. In the past five years most countries have endorsed the recommendations of the World report on road traffic injury prevention which give guidance on how countries can implement a comprehensive approach to improving road safety and reducing the death toll on their roads.

    To date, however, there has been no global assessment of road safety that indicates the extent to which this approach is being implemented. This Global status report on road safety is  the first broad assessment of the status of road safety in 178 countries, using data drawn from a standardized survey conducted in 2008.

    The results show that road traffic injuries remain an important public health problem, particularly for low-income and middle-income countries. Pedestrians, cyclists and motorcyclists make up almost half of those killed on the roads, highlighting the need for these road users to be given more attention in road safety programmes.
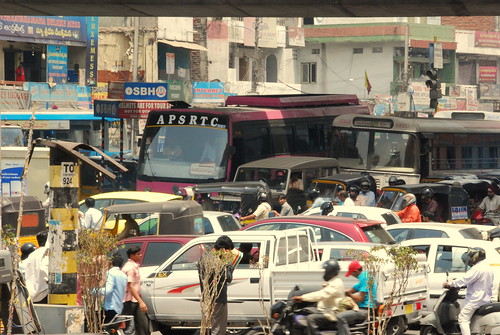
    Image Courtesy: Apture

    The results also suggest that in many countries road safety laws need to be made more comprehensive while enforcement should be strengthened. TheGlobal status report on road safety results clearly show that significantly more action is needed to make the world’s roads safer.

    The results provide a benchmark that countries can use to assess their road safety position relative to other countries, while internationally the data presented can collectively be considered as a global “baseline” against which progress over time can be measured.  Here is a quick summary of key findings from WHO’s Director-General, Dr. Margaret Chan’s  statement during the June 15, 2009 release of the report in New York City:

    • Over 90% of these deaths occur in low-income and middle-income countries, which have less than half of the world’s registered vehicles.
    • Second, the report highlights that nearly half of those dying on the world’s roads are pedestrians, cyclists or motorcyclists. These people, who lack the protective shell of a car, are particularly vulnerable to severe and fatal injuries following a crash.  In some low-income and middle-income countries, this proportion is even higher, with up to 80% of road traffic deaths among these vulnerable groups. Clearly we are not giving enough attention to the needs of pedestrians, cyclists and motorcyclists, many of whom end up in clinics and emergency rooms, overloading already stretched health-care systems.
    • Third, the report shows that, in many countries, the laws needed to protect people are either not in place or too limited in their scope. Indeed, only 15% of countries have comprehensive laws on all the risk factors we measured. And even when legislation is adequate, most countries report that enforcement is low.  The development and effective enforcement of legislation are key ways to reduce drink-driving and excessive speed, and to increase the use of helmets, seat-belts and child restraints.
    • Finally, the report demonstrates that in many countries information about road traffic injuries is scarce. To set priorities and target and evaluate their actions, countries need to know the size of the problem, and additional information such as which groups are most affected.

    Click here to access the PDF report.