Chart of the day: The Bike Sharing World – 2014 – Year End Data

Image Courtesy: Russell Meddin bikesharephiladelphia.org via The Bike-sharing Blog
Image Courtesy: Russell Meddin bikesharephiladelphia.org via The Bike-sharing Blog
Strongtowns.org has a compelling piece that explains the funding crisis in transportation and why the U.S. transportation system is going broke. This Strongtowns article points to the set of graphics below, which are actually part of a lengthy write-up on Star Tribune that dissects the state of Minnesota’s transportation funding issues. In all, you get a good understanding of the fundamental disparities when it comes to the state of our unsustainable transportation financing methods and how badly we need a dramatic shift in our approach (H/T Streetsblog for sharing this article via Facebook).
Image Courtesy: Star Tribune. Click on the graphic to be linked to the source story
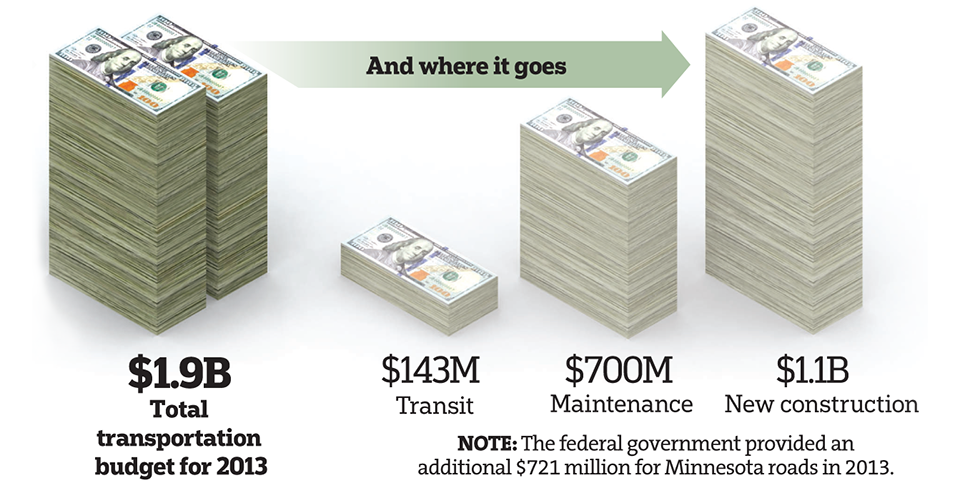
Image Courtesy: Star Tribune via Strongtowns.org. Click on the graphic to be linked to the source story
Image Courtesy: Star Tribune. Click on the graphic to be linked to the source story
via Yahoo Tech

Image courtesy: Yahoo.com “Calling for an ride after midnight? We hope you saved up for it.”
The chart comes to us via Dan Tynan’s “12 Ways to Avoid Uber and Still Get Home Safely on New Year’s Eve“. If you are one of them brave souls venturing out tonight in the West Coast cities of Sacramento, San Francisco, San Diego or Seattle , I highly recommend checking out FlyWheel, who is offering a $10 flat fee rides from 8PM until 3AM. Dan Tynan has done a great job identifying the various alternatives for you to get around safely after a fun night out. One additional smartphone app that I’d like to recommend in addition to Dan’s collection is @RideScout. This mobile app will help you get from point A to point B faster and smarter. RideScout shows you real-time information about transportation options that are available right now around you, including transit, bus, bike, taxi, car share, rideshare, parking and walking directions – all in one view. Now, how cool is that!
I’d like to also use this as an opportunity to wish all my reader a SAFE & Happy New Year! Thank you for your continued support and I promise to keep you even more informed in 2015.
The recent chaos in New York City involving the Mayor and the Cops Union has taken some ugly turns and dramatically played out in the media. One of the subtle impacts of this mess was keenly felt on the streets of New York as explained by this local news outlet, New York Post. Statistics obtained by The Post show a dramatic drop in NYPD’s traffic and parking enforcement activities between Dec. 22 — the first weekday after the double cop assassination — and Sunday Dec. 28, compared with the same period last year. There are many ways to interpret the numbers but it clearly shows something is off. According to The Post, police sources cited safety concerns as the main reason for the dropoff in police activity, but added that some cops were mounting an undeclared slowdown in protest of de Blasio’s response to the non-indictment. The Patrolmen’s Benevolent Association has warned its members to put their safety first and not make arrests “unless absolutely necessary.” This brings to question what is the correlation between traffic safety and the drop in violations during this period. Click here to read the full story.

Image via New York Post
via @UrbanData on Twitter
The following tweet will take you to the source article.
The @drshow replaying interiew w/ @mrichtel promoting ad that includes this bogus claim see: https://t.co/HpQtKsAJJM pic.twitter.com/g50evc2opY
— Philip N. Cohen (@familyunequal) December 26, 2014
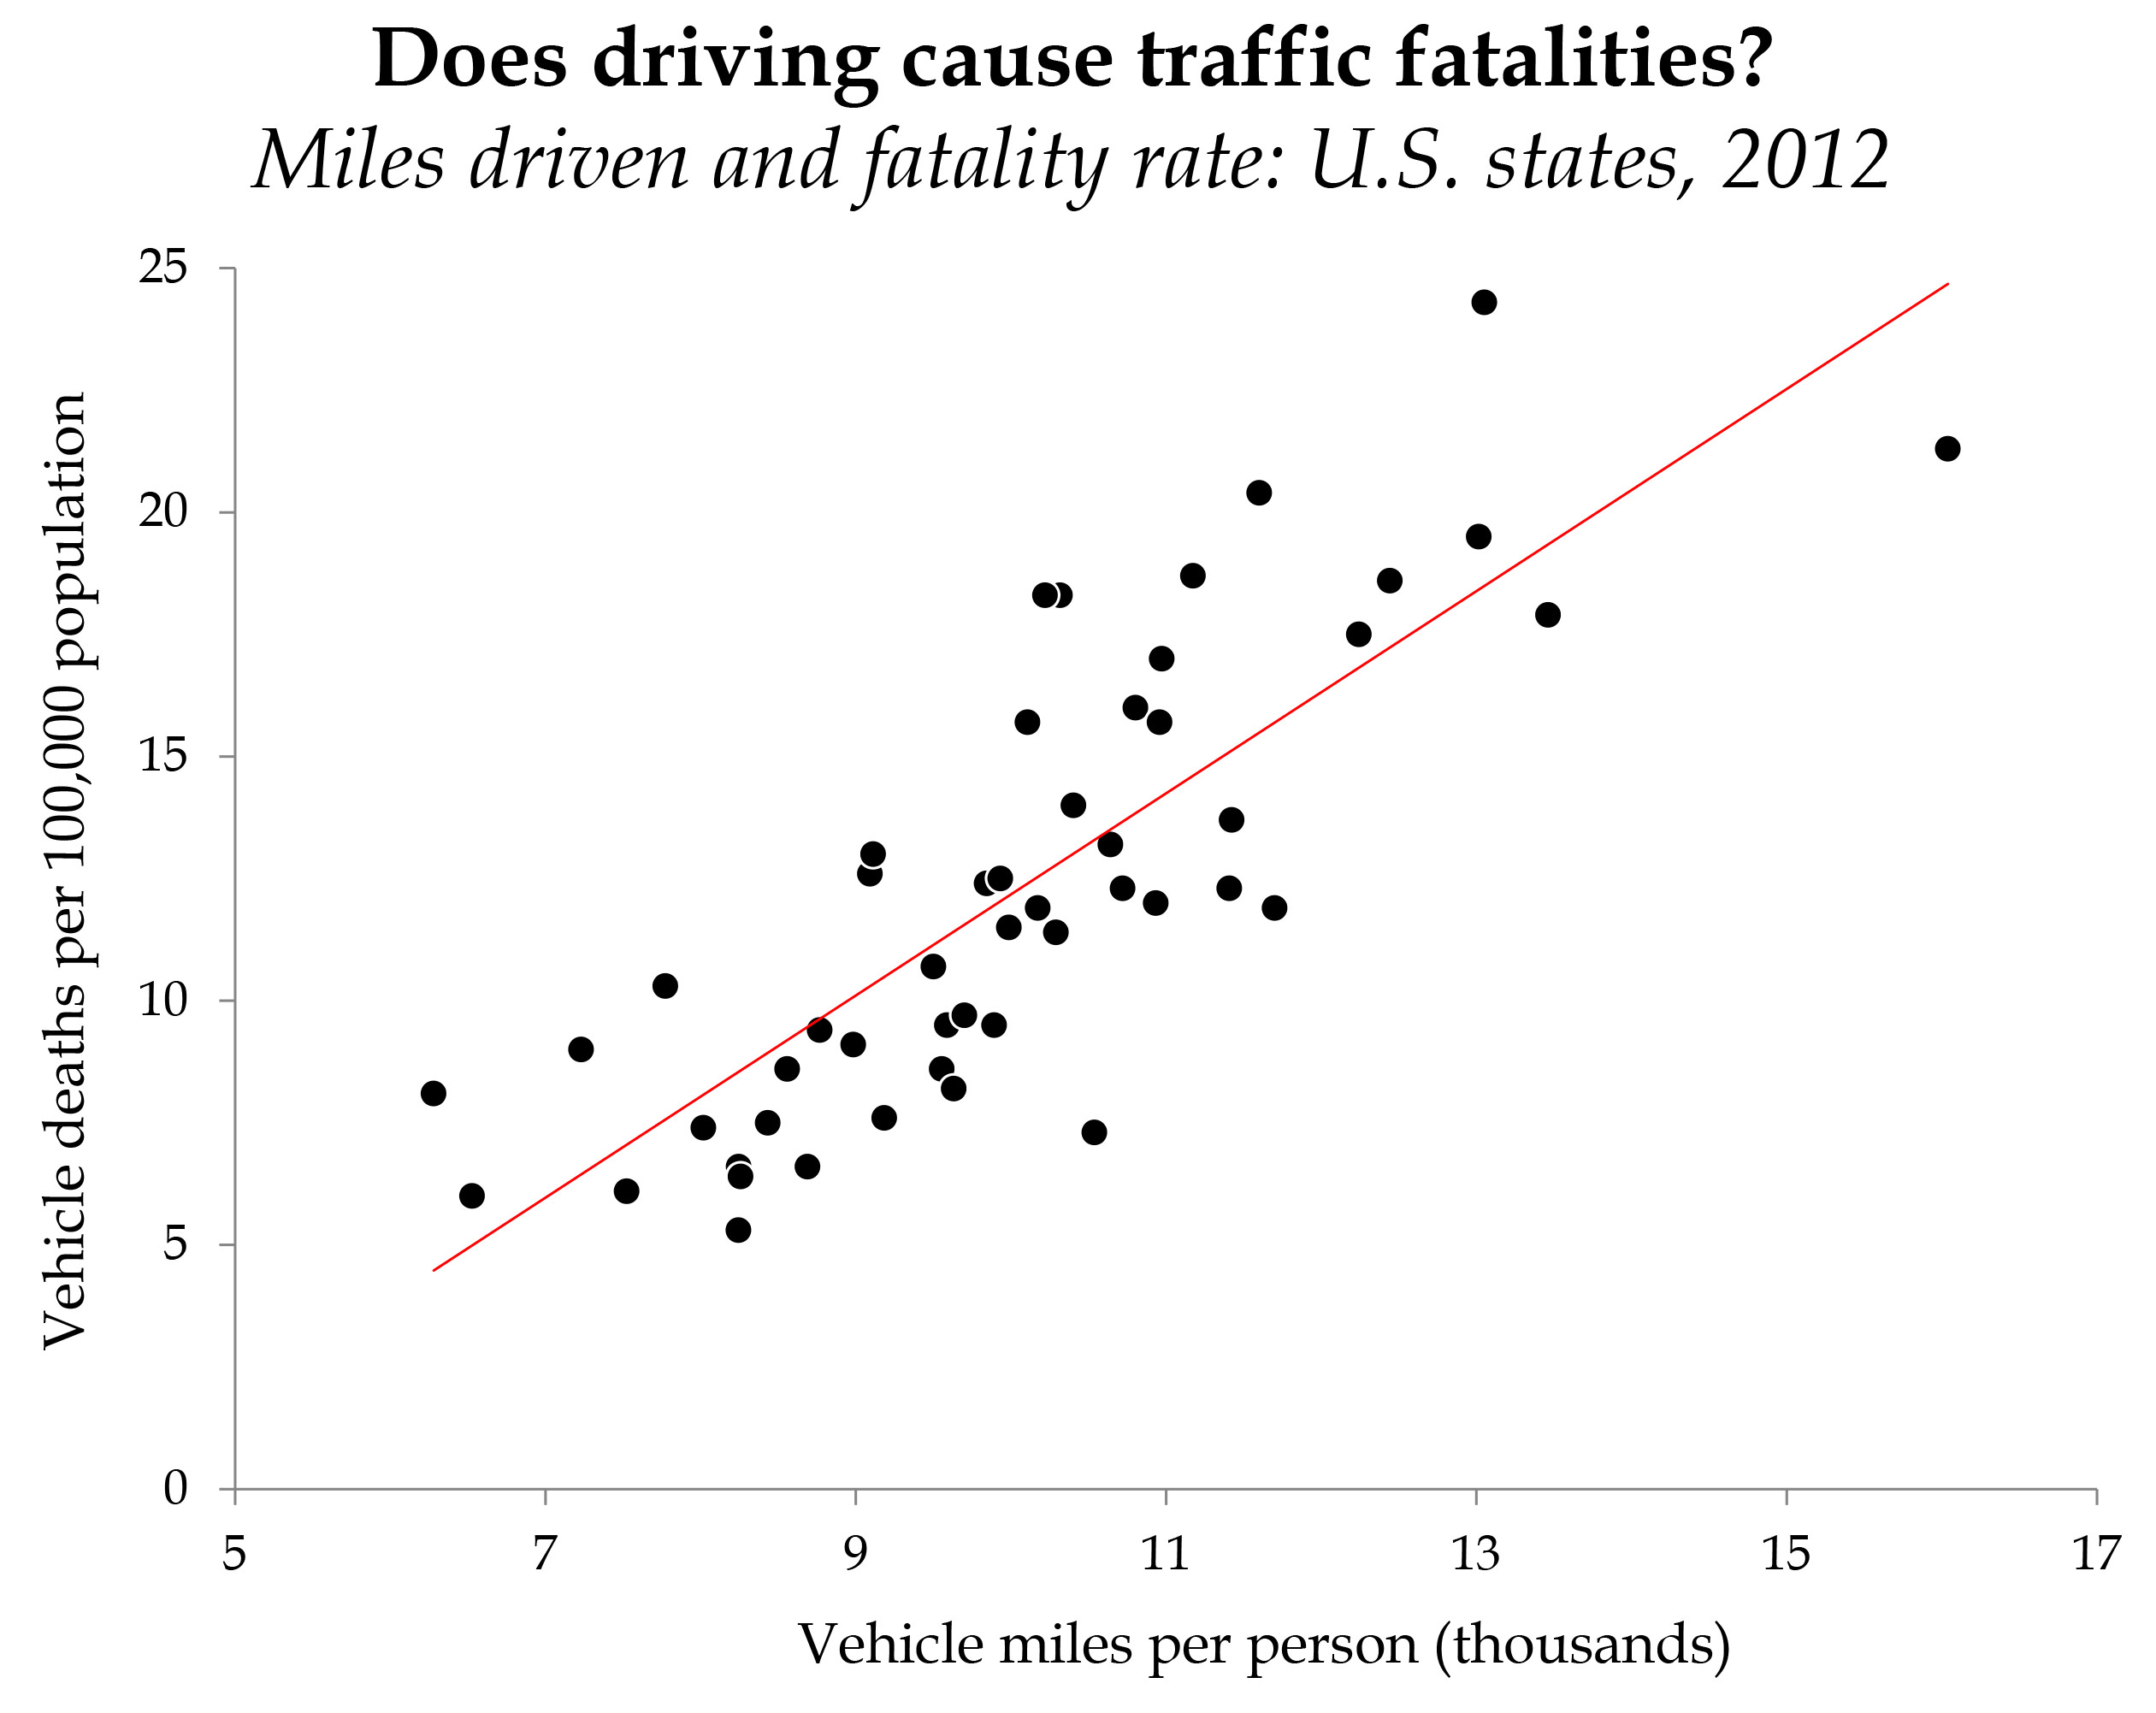
Image via: familyineqaulity.wordpress.com
.@familyunequal @drshow @mrichtel Driving, speeding, and urban sprawl are the major predictors of traffic deaths pic.twitter.com/LvXQ8JCSsc
— urbandata (@urbandata) December 26, 2014