Cars are the worst space hogs in our urban environments

December 29, 2014 at 12:45 pm

This graphic puts the use of space by each surface transportation mode in perspective.. and it is quite obvious that cars eat up a lot of space in our urban environments.

Look beyond the sticker shock — Infograph: Real Cost of Vehicle Ownership

April 22, 2014 at 5:49 pm

The new infograph published by SafeCar.Info. offers some good insights into the real cost of owning a vehicle.  To put it simply, owning a car these days is not easy on any wallet.  the infograph provides a clear guide to the issues which everyone should consider before they make their final decision. 

Source: SafeCar.info. Click Image to learn more.

Via: Safecar.info | Car safety & Insurance Magazine


Enhanced by Zemanta

That’s a lot of space! Making the case for sustainable public transportation with a brilliant GIF

November 19, 2013 at 5:00 pm

We all know our “developed” societies have way too many cars and often choke up our streets and take up valuable space, resulting in terrible congestion and chronic bottle necks.. If a lot of people chose to leave behind their cars and instead opt for public transportation, it will be a perfect anti-dote for the chronic congestion that plagues our streets. So, how do you tell this story effectively? Here is one way to do it.. I call this the mother of all sustainable transportation images (courtesy of The Atlantic)

Let me tell ya.. The amount of road space saved when a few dozen people switch from driving cars to riding the public transport is ENORMOUS.

The best vehicle to arrive in for the Sunday brunch – Ford’s Bacon wrapped Fiesta

August 28, 2013 at 11:24 pm

Ford is giving customers the chance to wrap their 2014 Ford Fiestas in bacon to celebrate International Bacon Day (August 31). The wraps are available along with Ford’s other less-delicious looking wraps on the Fiesta graphics website. Prices start at $78 plus installation.  I wonder what will happen if such a vehicle arrives in the Middle East, where pork is a strict no no.

Bacon wrapped Horsepower – Image courtesy: Time.com 

Read more: http://newsfeed.time.com/2013/08/28/finally-you-can-wrap-your-ford-in-bacon/#ixzz2dKA8bUBl

Enhanced by Zemanta

Car wash from hell?

July 8, 2013 at 8:00 am

Probably some god awful things happened at this car wash? LOL.

Source: Imgur via Reddit

Buckle Up. Stay Alive – Brilliant Advertisement Subtly Delivers Seat Belt Safety Message

May 6, 2013 at 11:09 pm

Source: Imgur

A bit of background: This image is part of a safety campaign by Canadian provincial agency Societe de l’assurance automobile (SAAQ) urging people to wear seat belts in the car. SAAQ (whose translation in English roughly equates to Quebec Automobile Insurance Corporation) developed a set of  posters,including the one below, for displaying in bars and restaurants from August 27 to September 23, 2012..

Very clever driving safety ad.. Source: Imgur via Reddit

Click here to see the other posters in this campaign.

Measuring congestion – Texas Transportation Institute releases 2012 Urban Mobility Report

February 5, 2013 at 5:34 pm

Today TTI had released its latest edition of the popular product – Urban Mobility Report (2012). The 2012 edition introduced for the first time,  a way to measure that degree of unreliability in planning a trip, as part of the annual Urban Mobility Report (UMR).   The press release explains it succintly:

The Planning Time Index (PTI), a measure of travel reliability, illustrates the amount of extra time needed to arrive on time for higher priority events, such as an airline departure, just-in-time shipments, medical appointments or especially important social commitments. If the PTI for a particular trip is 3.00, a traveler would allow 60 minutes for a trip that typically takes 20 minutes when few cars are on the road. Allowing for a PTI of 3.00 would ensure on-time arrival 19 out of 20 times.

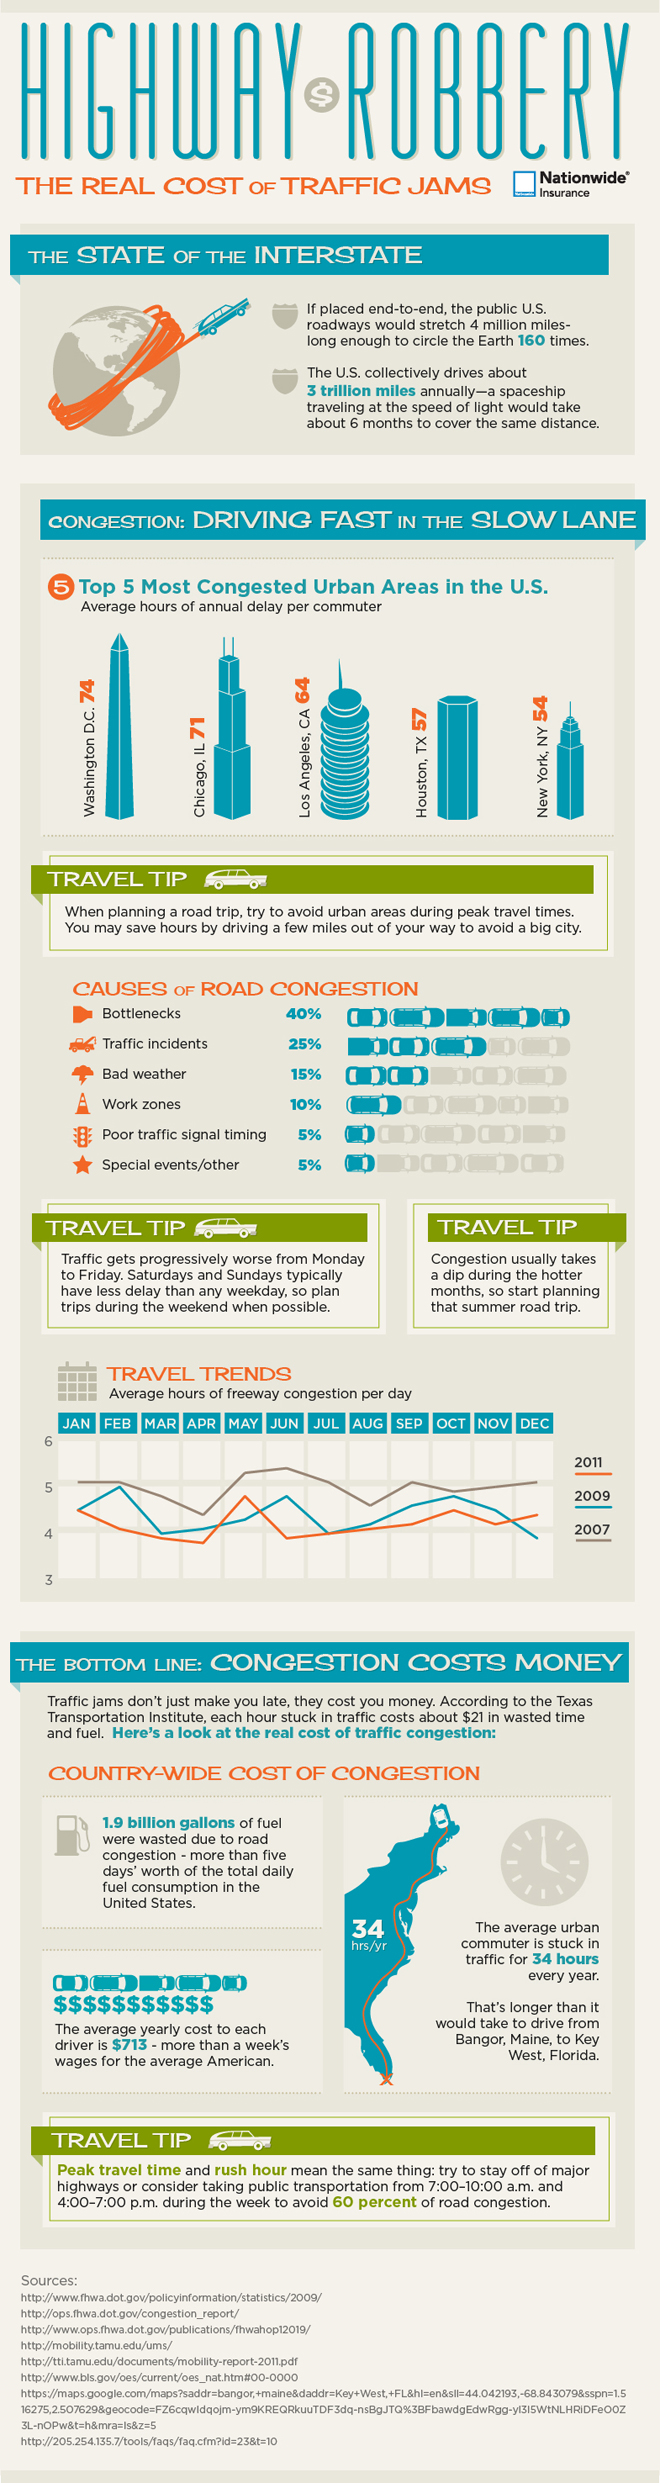
Access the whole report (PDF) by clicking the cover photo of the report below.

TTI's 2012 Urban Mobility Report

TTI’s 2012 Urban Mobility Report

As one would expect, the reactions for the report was mixed – both positive and negative from the transportation community.  That said, here are some highlights from the 2012 UMR:

Congestion costs are increasing. The congestion “invoice” for the cost of extra time and fuel in 498 urban areas was (all values in constant 2011 dollars):

  • In 2011 – $121 billion; In 2000 – $94 billion; In 1982 – $24 billion

Congestion wastes a massive amount of time, fuel and money. In 2011:

  • 5.5 billion hours of extra time (equivalent to the time businesses and individuals spend a year filing their taxes).
  • 2.9 billion gallons of wasted fuel (enough to fill four New Orleans Superdomes).
  • $121 billion of delay and fuel cost (the negative effect of uncertain or longer delivery times, missed meetings, business relocations and other congestion-related effects are not included) ($121 billion is equivalent to the lost productivity and direct medical expenses of 12 average flu seasons).
  • 56 billion pounds of additional carbon dioxide (CO2) greenhouse gas released into the atmosphere during urban congested conditions (equivalent to the liftoff weight of over 12,400 Space Shuttles with all fuel tanks full).
  • 22% ($27 billion) of the delay cost was the effect of congestion on truck operations; this does not include any value for the goods being transported in the trucks.
  • The cost to the average commuter was $818 in 2011 compared to an inflation-adjusted $342 in 1982.

    English: Traffic congestion on southbound Inte...

    English: Traffic congestion on southbound Interstate 95 in Baltimore, Maryland, near milepost 50. (Photo credit: Wikipedia)

Congestion affects people who travel during the peak period. The average commuter:

  • Spent an extra 38 hours traveling in 2011, up from 16 hours in 1982.
  • Wasted 19 gallons of fuel in 2011 – a week’s worth of fuel for the average U.S. driver – up from 8 gallons in 1982.
  • In areas with over three million persons, commuters experienced an average of 52 hours of delay in 2011.
  • Suffered 6 hours of congested road conditions on the average weekday in areas over 3 million population.
  • Fridays are the worst days to travel. The combination of work, school, leisure and other trips mean that urban residents earn their weekend after suffering over 20 percent more delay hours than on Mondays.
  • And if all that isn’t bad enough, folks making important trips had to plan for approximately three times as much travel time as in light traffic conditions in order to account for the effects of unexpected crashes, bad weather, special events and other irregular congestion causes.

Congestion is also a problem at other hours. 

  • Approximately 37 percent of total delay occurs in the midday and overnight (outside of the peak hours) times of day when travelers and shippers expect free-flow travel. Many manufacturing processes depend on a free-flow trip for efficient production and congested networks interfere with those operations.

Enhanced by Zemanta

Infograph: A Visual History of The Greatest Cars In Hollywood

December 3, 2012 at 5:04 pm

Heard of talking cars? Teen drivers of today would probably think of an internet-connected car like Ford Focus offering interactive feedback via Sync. But the older (or teens of the 80s!?) folks would fondly remember the KITT, a real talking supercar that was a central feature in the TV Series, Knight Rider. This story of a lone crimefighter battling the forces of evil with the help of an indestructible and artificially intelligent supercar captured the minds and hearts of many gearheads back in the 80s.  As years grew, so have the fascination and sophistication of the cars used by Hollywood.  We have left the KITT behind and arrived in the era of the Batmobile.  Here is a visual walkthrough compiled by AutoInsurance.us that crisply captures the greatest cars in Hollywood history. Check it out.

The Greatest Cars In Hollywood

Post Made Possible by AutoInsurance.US

Enhanced by Zemanta

Bleeding Treasure – Nationwide Insurance’s Infograph shows the impact of congested traffic on our wallet

October 19, 2012 at 3:17 pm

(via Nationwide)

To put it in simple terms, we blow up a lot of money sitting in traffic day in and day out.  Traffic congestion not only takes a toll on your mental & physical well being, but it also brings home a lot of economic pain. It is nice to see someone layout all this important statistics in an easy to understand, colorful visual.

So, how do we fix this mess? A good start would be to move towards transit-oriented development and provide good, cost-effective transit connectivity to the suburbs.. And add some bike lanes; etc, etc.  The solutions are plenty but we have to start somewhere before we go bankrupt.. soon!
The cost of traffic congestion.
Provided by Nationwide Insurance

Infograph – When the Radio Met the Car: Tracing the 82-Year Evolution That Rocked Your Dashboard

May 30, 2012 at 2:37 pm

(source: CBSnews)

Car radio history infographic

Image Courtesy: CBSnews.com