Investing in transit helps save money for the entire community – Infograph: Fight Traffic with Rapid Transit

April 22, 2014 at 7:47 pm

Check out this infograph from Pembina Institute that clearly lays out the case for public transportation (i.e., Rapid Transit) and shows how much money can be saved..

Source: Pembina Institute.

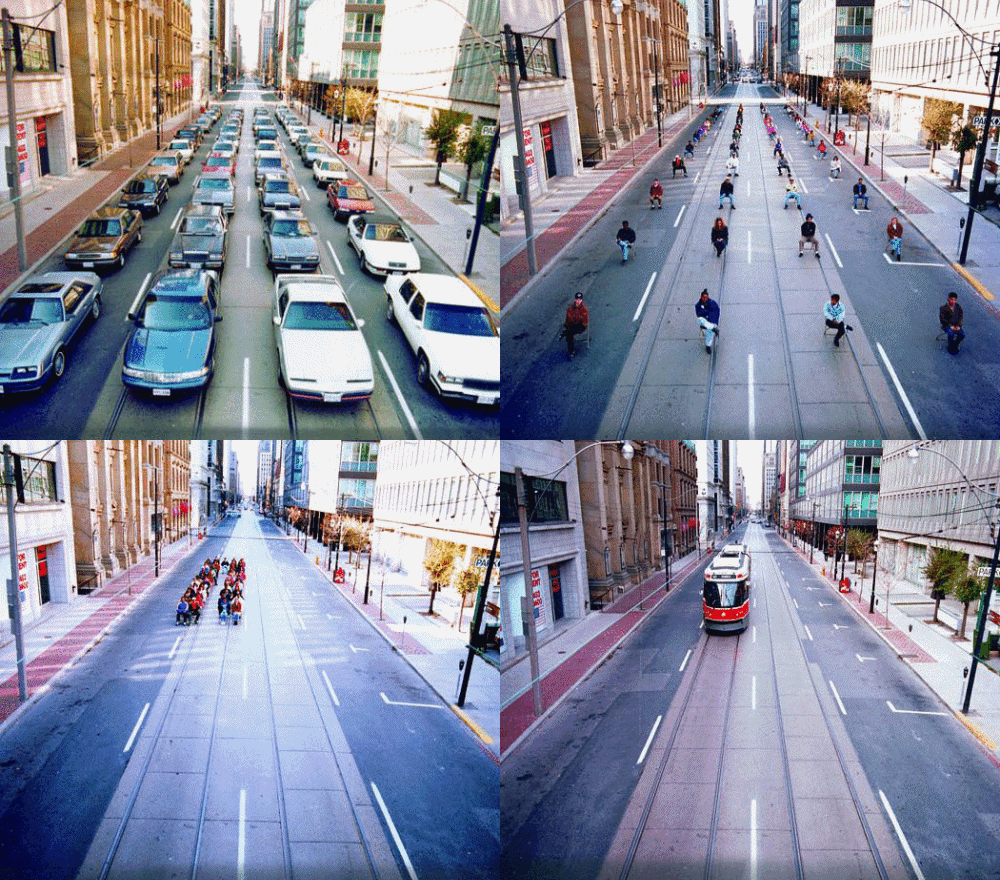
That’s a lot of space! Making the case for sustainable public transportation with a brilliant GIF

November 19, 2013 at 5:00 pm

We all know our “developed” societies have way too many cars and often choke up our streets and take up valuable space, resulting in terrible congestion and chronic bottle necks.. If a lot of people chose to leave behind their cars and instead opt for public transportation, it will be a perfect anti-dote for the chronic congestion that plagues our streets. So, how do you tell this story effectively? Here is one way to do it.. I call this the mother of all sustainable transportation images (courtesy of The Atlantic)

Let me tell ya.. The amount of road space saved when a few dozen people switch from driving cars to riding the public transport is ENORMOUS.

Infograph: NYC publishes one month report card for its popular bikeshare program

July 1, 2013 at 6:44 pm

NYC Mayor Mike Bloomberg’s twitter account shared this awesome infograph this afternoon, detailing the stats/numbers behind the Citibike Bikesharing Program as it completed its wildly successful 1st month.  At this rate, NYC can be assured that it is a smashing success and will remain a key part of the city’s transportation infrastructure for decades to come.  Check it out the infograph below (also check out the comments in the embedded tweet below)

Image Courtesy: twitter.com/mikebloomberg

And someone just posted this “Rush hour”  pic. on twitter

New NYC Rush hour (via Instagram.com/gudphoto)

Measuring congestion – Texas Transportation Institute releases 2012 Urban Mobility Report

February 5, 2013 at 5:34 pm

Today TTI had released its latest edition of the popular product – Urban Mobility Report (2012). The 2012 edition introduced for the first time,  a way to measure that degree of unreliability in planning a trip, as part of the annual Urban Mobility Report (UMR).   The press release explains it succintly:

The Planning Time Index (PTI), a measure of travel reliability, illustrates the amount of extra time needed to arrive on time for higher priority events, such as an airline departure, just-in-time shipments, medical appointments or especially important social commitments. If the PTI for a particular trip is 3.00, a traveler would allow 60 minutes for a trip that typically takes 20 minutes when few cars are on the road. Allowing for a PTI of 3.00 would ensure on-time arrival 19 out of 20 times.

Access the whole report (PDF) by clicking the cover photo of the report below.

TTI's 2012 Urban Mobility Report

TTI’s 2012 Urban Mobility Report

As one would expect, the reactions for the report was mixed – both positive and negative from the transportation community.  That said, here are some highlights from the 2012 UMR:

Congestion costs are increasing. The congestion “invoice” for the cost of extra time and fuel in 498 urban areas was (all values in constant 2011 dollars):

  • In 2011 – $121 billion; In 2000 – $94 billion; In 1982 – $24 billion

Congestion wastes a massive amount of time, fuel and money. In 2011:

  • 5.5 billion hours of extra time (equivalent to the time businesses and individuals spend a year filing their taxes).
  • 2.9 billion gallons of wasted fuel (enough to fill four New Orleans Superdomes).
  • $121 billion of delay and fuel cost (the negative effect of uncertain or longer delivery times, missed meetings, business relocations and other congestion-related effects are not included) ($121 billion is equivalent to the lost productivity and direct medical expenses of 12 average flu seasons).
  • 56 billion pounds of additional carbon dioxide (CO2) greenhouse gas released into the atmosphere during urban congested conditions (equivalent to the liftoff weight of over 12,400 Space Shuttles with all fuel tanks full).
  • 22% ($27 billion) of the delay cost was the effect of congestion on truck operations; this does not include any value for the goods being transported in the trucks.
  • The cost to the average commuter was $818 in 2011 compared to an inflation-adjusted $342 in 1982.

    English: Traffic congestion on southbound Inte...

    English: Traffic congestion on southbound Interstate 95 in Baltimore, Maryland, near milepost 50. (Photo credit: Wikipedia)

Congestion affects people who travel during the peak period. The average commuter:

  • Spent an extra 38 hours traveling in 2011, up from 16 hours in 1982.
  • Wasted 19 gallons of fuel in 2011 – a week’s worth of fuel for the average U.S. driver – up from 8 gallons in 1982.
  • In areas with over three million persons, commuters experienced an average of 52 hours of delay in 2011.
  • Suffered 6 hours of congested road conditions on the average weekday in areas over 3 million population.
  • Fridays are the worst days to travel. The combination of work, school, leisure and other trips mean that urban residents earn their weekend after suffering over 20 percent more delay hours than on Mondays.
  • And if all that isn’t bad enough, folks making important trips had to plan for approximately three times as much travel time as in light traffic conditions in order to account for the effects of unexpected crashes, bad weather, special events and other irregular congestion causes.

Congestion is also a problem at other hours. 

  • Approximately 37 percent of total delay occurs in the midday and overnight (outside of the peak hours) times of day when travelers and shippers expect free-flow travel. Many manufacturing processes depend on a free-flow trip for efficient production and congested networks interfere with those operations.

Enhanced by Zemanta

When s**t hit the roof .. In East Timor, the Prime Minister Gets On the Street To Direct Traffic and Ease Gridlock

January 7, 2013 at 12:23 pm

(Image Courtesy: European PressPhoto Agency via NBCNews)

Prime minister turns traffic cop after hitting East Timor gridlock Image Courtesy: EPA via NBC News

Prime minister turns traffic cop after hitting East Timor gridlock Image Courtesy: EPA via NBC News

How often you see the leader of a nation get down to the street and direct traffic flow?  The answer is NEVER. But that changed today. The Prime Minister of East Timor, Xanana Gusmao, turned traffic cop on Monday after his car got stuck in a traffic jam outside the presidential office in the capital Dili.


This is Why Post-Sandy New York City Should Seriously Consider Bus Rapid Transit (and all things Transit)

October 31, 2012 at 5:33 pm

Saw this picture below tweeted out by joanna coles @JoannaColes Editor-in-Chief Cosmopolitan Magazine. She shot this gridlocked thoroughfare from her office (located on the 38th floor of the building where Cosmopolitan mag. is located).  With its subway system crippled by Sandy, this pic. shows how badly NYC needs to reconsider its transportation strategies and prioritize implementing any/all strategies that moves people away from cars.  It is going to be once heck of a recovery until the subway limps back to normal!   

View of a Gridlocked New York City


Enhanced by Zemanta

Adding Ammo To The Argument: Why Riding A Motorcycle Is Good (& Encouraged) In Britain

June 6, 2012 at 4:56 pm

A few days back we saw a nice video from RidetoWorkUK , promoting motorcycles as a commuting option.  And today I saw this new video posted by a British biker showing how wonderfully he bypassed a longggg traffic queue by hopping on the dedicated bus lane.  And with that today I learned, motorcycles are allowed to use bus lanes in some parts of UK..

[yframe url=’http://www.youtube.com/watch?v=MxDeXZSfAzM&hd=1‘]

Why are we not doing that in this part of the world (i.e., US)? Or do you know of any cities where such a practice is in place?

Moving Los Angeles – Cool infographic shows Angelenos’ addiction to cars

November 23, 2011 at 1:38 pm

(Source: Good)

An interesting graphic. Hopefully the share of Transit rises in the years ahead along with other non-car options.  What is most appalling is that biking has only 0.99%  share of the pie.  LA needs to go a long way in moving its people away from cars.

A GOOD.is Transparency

Click image to enlarge

Quantifying The Mess – An Awesome Infographic Captures Cities With The Most Frustrating Traffic Problems

November 22, 2010 at 1:29 am

(Source: Good)

Click Image to Enlarge

A GOOD.is Transparency

Cities with the most frustrating traffic problems

Have interesting ideas for solving the traffic congestion problem? ITS Congestion Challenge gives $50,000 for the best idea

June 10, 2009 at 11:08 am

The Intelligent Transportation Society of America (ITS America), in partnership with IBM and Spencer Trask Collaborative Innovations (STCI), has launched a global challenge to identify innovative ideas for combating transportation congestion.

“The average metropolitan commuter in the U.S. spends nearly a full work week stuck in traffic each year, wasting precious time and fuel and impacting the environment, safety conditions on roads, and economic productivity to the tune of more than 1 percent of GDP,” said ITS America President and CEO Scott Belcher. “Allowing congestion to grind cities, suburbs and supply chains to a halt every morning and afternoon is unacceptable when we have innovative tools, technologies, and strategies available to manage our transportation systems and utilize our infrastructure more effectively.”

The ITS Congestion Challenge is a global competition to identify the best and most creative ideas to effectively reduce congestion and its impacts on the economy, environment, and quality of life.

The competition is open to entrepreneurs, commuters, transportation experts, researchers, universities, and citizens from all fields around the globe. All ideas will be reviewed discussed and rated by an open global community, to determine the best and most creative ideas to effectively solve the consequences of traffic congestion.

The winner will be announced during the 16th World Congress on Intelligent Transportation Systems in Stockholm, Sweden, September 21 – 25, 2009, and will receive a cash investment of $50,000 USD, as well as development and implementation support to pursue turning the ideas into real-world solutions.

More information is available on the competition including key attributes winning entries will be expected to incorporate. Participants will be able to post solutions, collaborate in an open community to improve solution entries, and ultimately vote for those solutions they believe best relieve the issues caused by congestion.